
K-12 IT reporting and analytics that your board actually reads.
Live dashboards for technicians, IT directors, business managers, and superintendents. Ticket trends, damage by month, MDM fleet health, loaner queues, every number CSV-exportable for board reports and grant accountability.
Help desk reporting
Ticket trend, by department, by priority, on one screen.
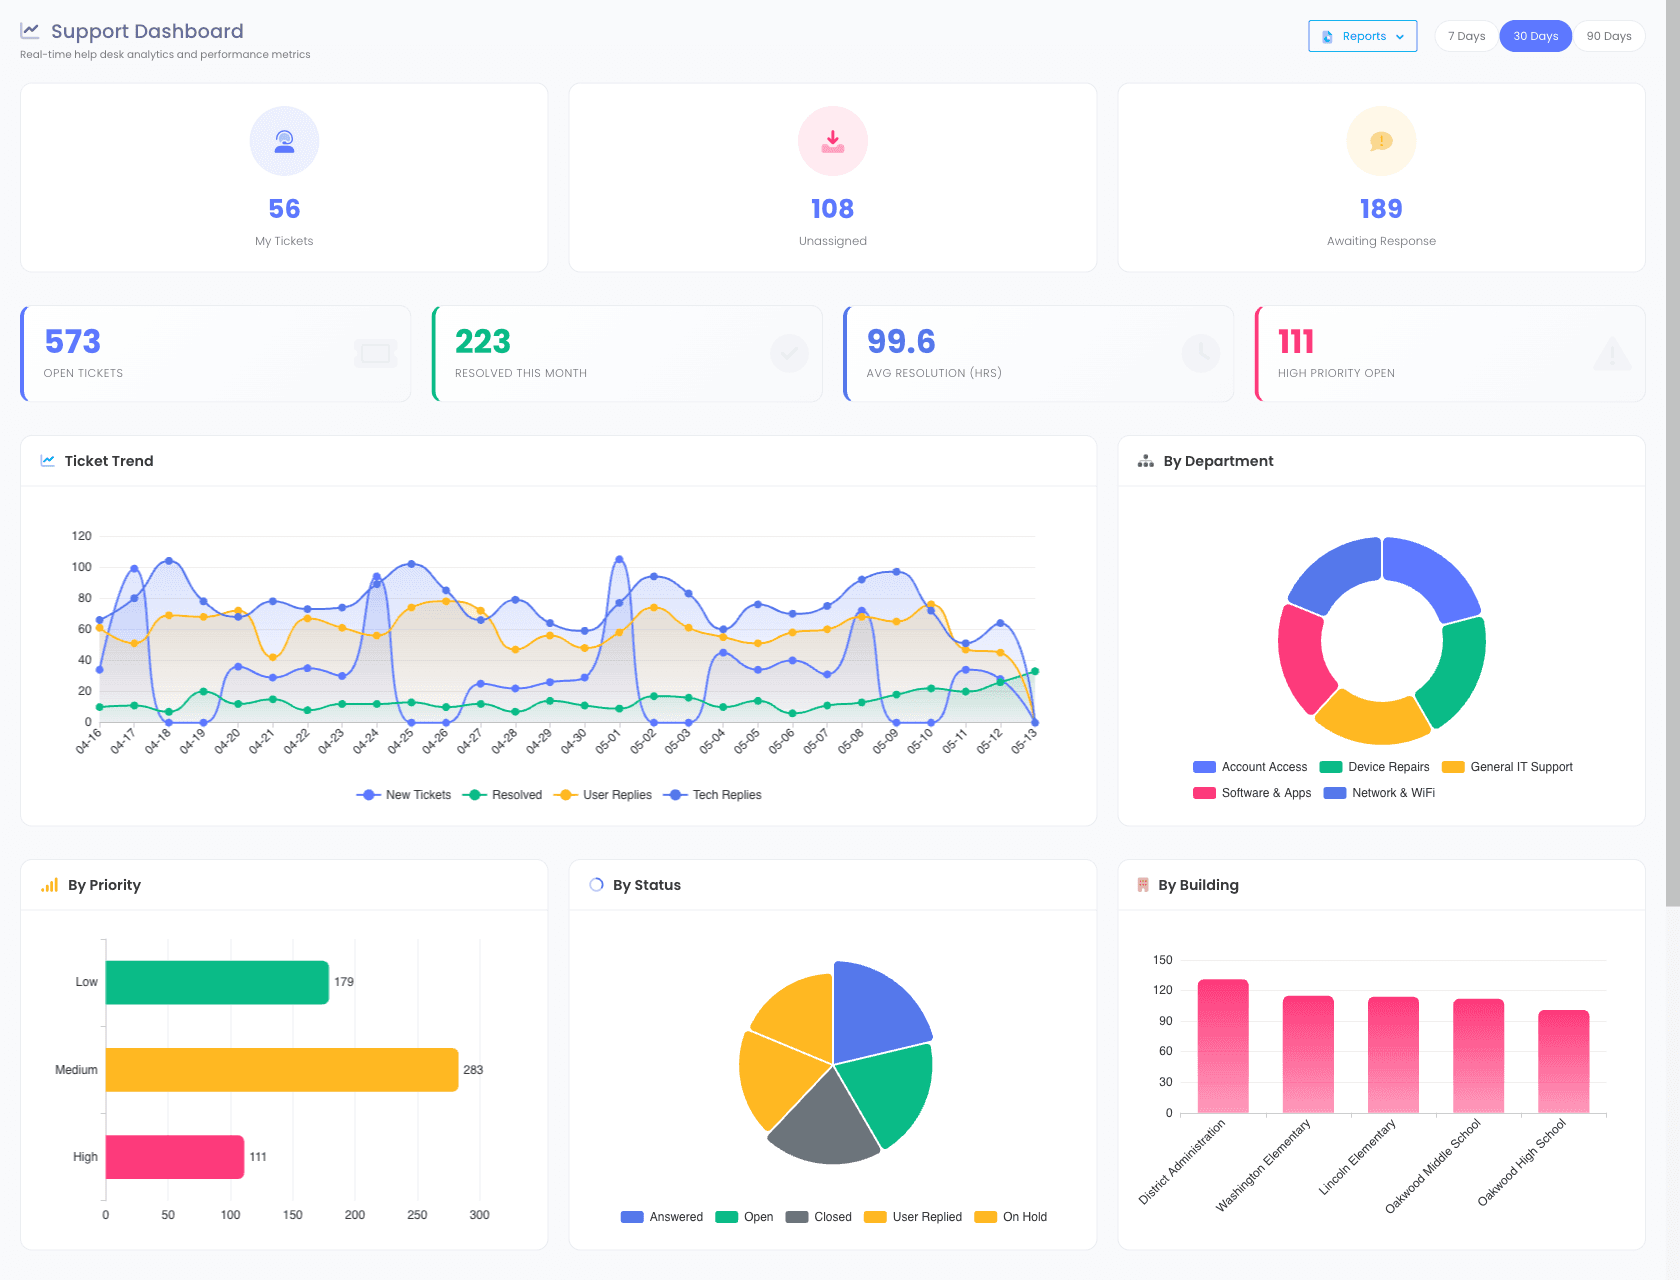
The Support Dashboard puts every ticket KPI on the same screen, open count, resolved this month, average resolution time, and trended ticket volume. Donut and pie cuts by department, priority, and status sit next to the trend so the "what changed?" answer is one glance away.
- Open / resolved / resolution-time KPI cards at the top
- Ticket trend over time, New, Tech Replies, User Replies
- By Department donut + By Building bar, see workload by site
- By Priority and By Status charts, triage health at a glance
- CSV export of any filtered view for board agendas
Damage trends
Damage by month, grade, and location.
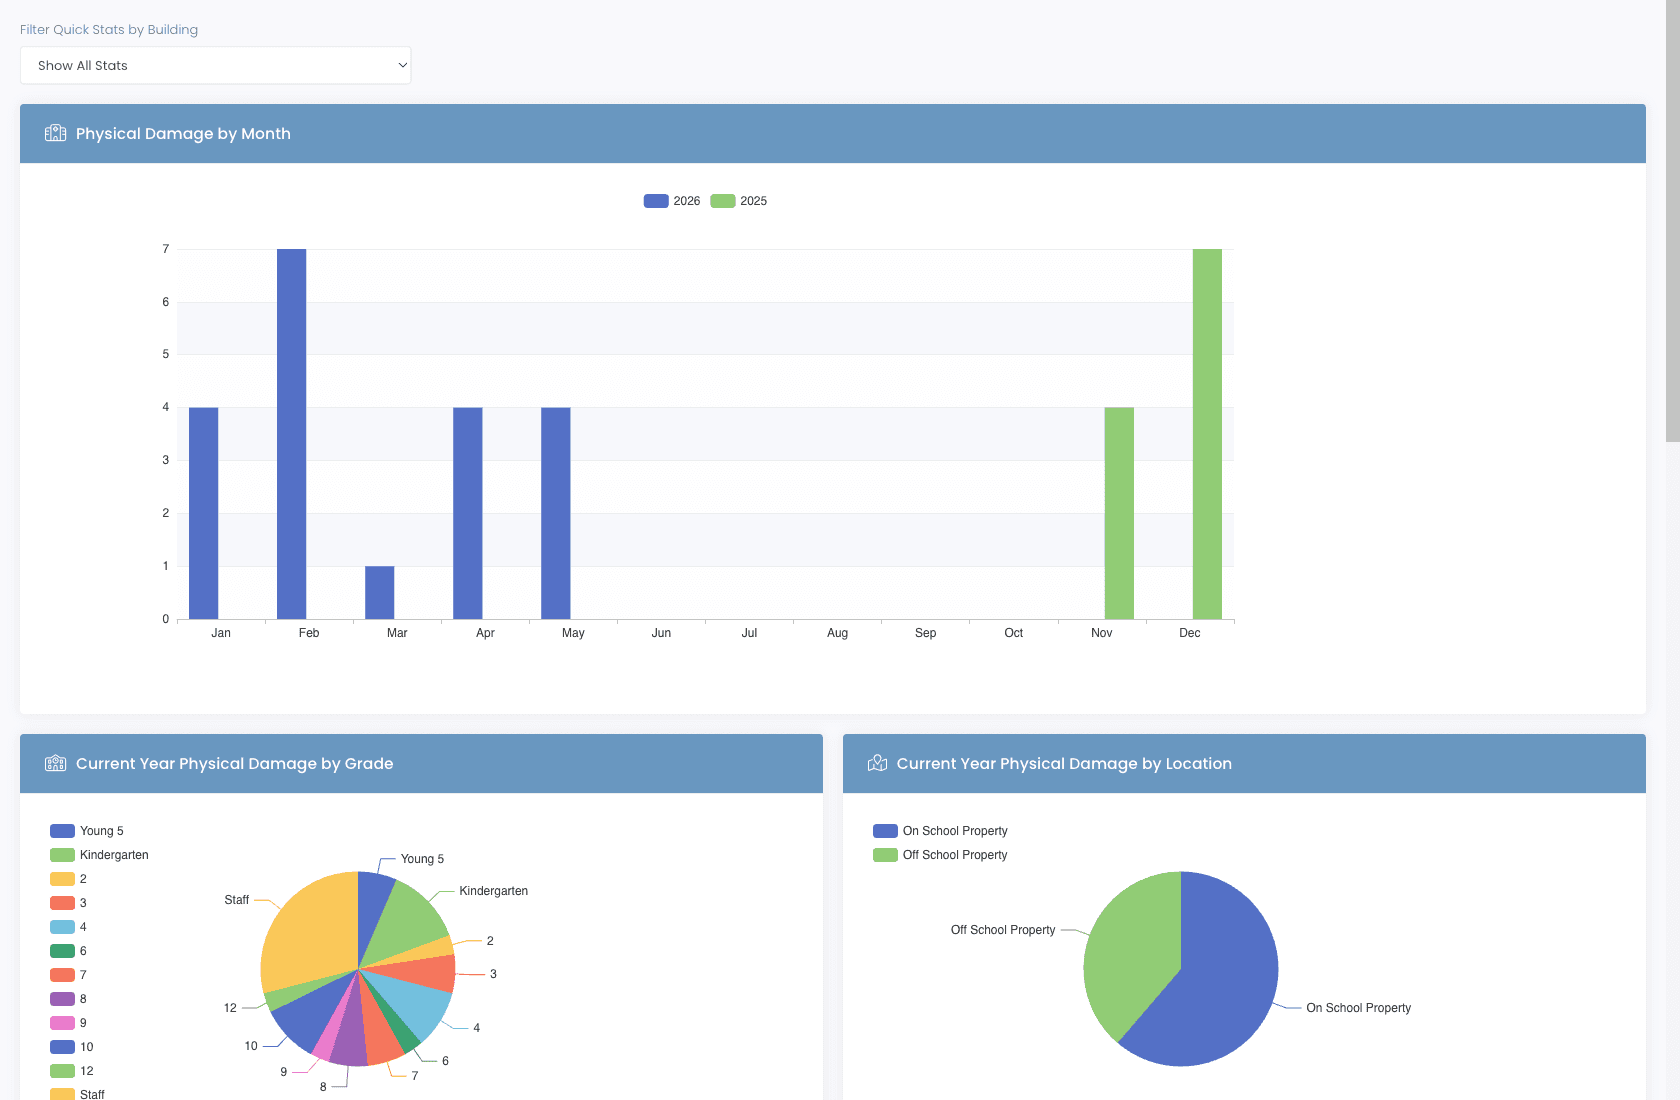
Which months spike for damage? Which grades return devices in the worst shape? On-property vs off-property, what's the split? The Quick Stats report answers all three with side-by-side year-over-year bars and breakdown pies, so you can shape next year's procurement and parent-handbook policy with real numbers.
- Physical damage by month, current year vs prior year
- Damage by grade, pinpoint which cohorts need device-care reminders
- On-school-property vs off-school-property breakdown
- Filter Quick Stats by building for site-by-site comparisons
- Export everything to CSV, survives the move into your board packet
Loaner reporting
Loaners. Out. Overdue. Returned.
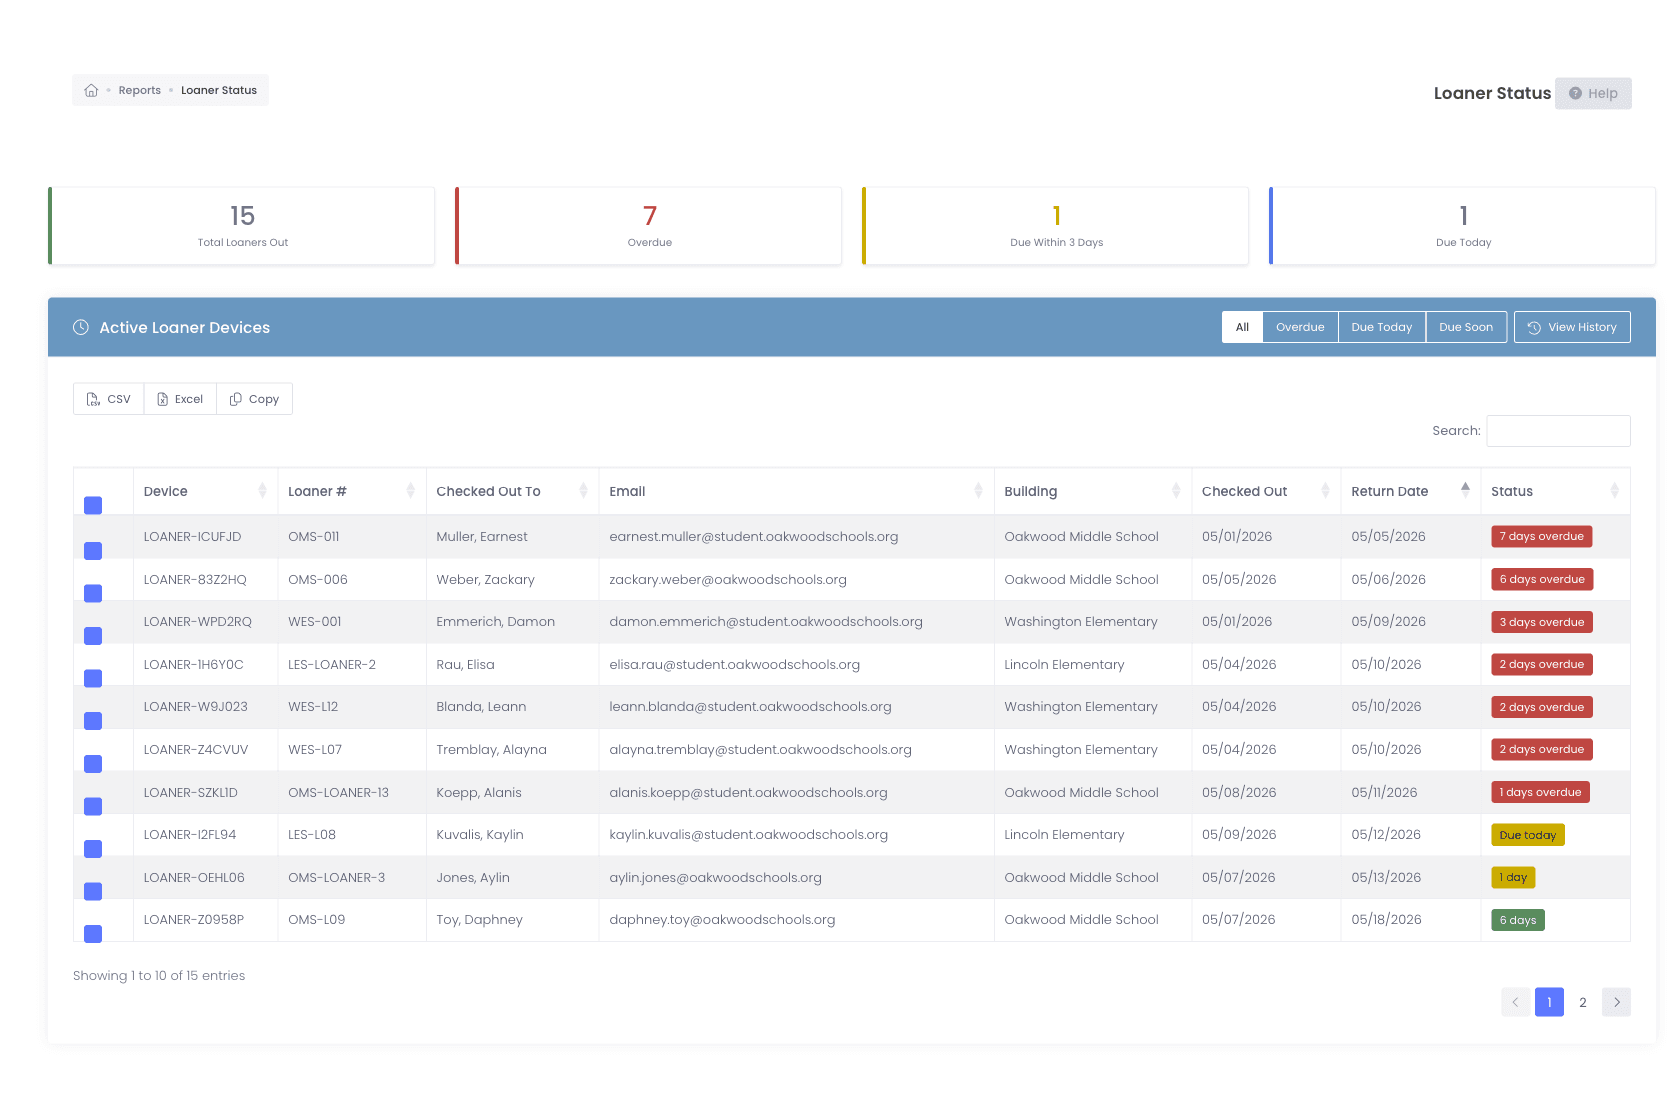
Loaner programs sound simple. Then you realize you have 15 of them out and seven are overdue. The Loaner Status report surfaces every counter at the top, total out, overdue, due today, due soon, with the underlying queue table sortable by building, return date, and student.
- Total / Overdue / Due Today / Due Soon counter cards
- Filterable queue by building, return date, status
- Loaner history report, issued, returned, lost, full audit trail
- CSV / Excel / Copy exports for board packets and parent letters
Incident queue + KPIs
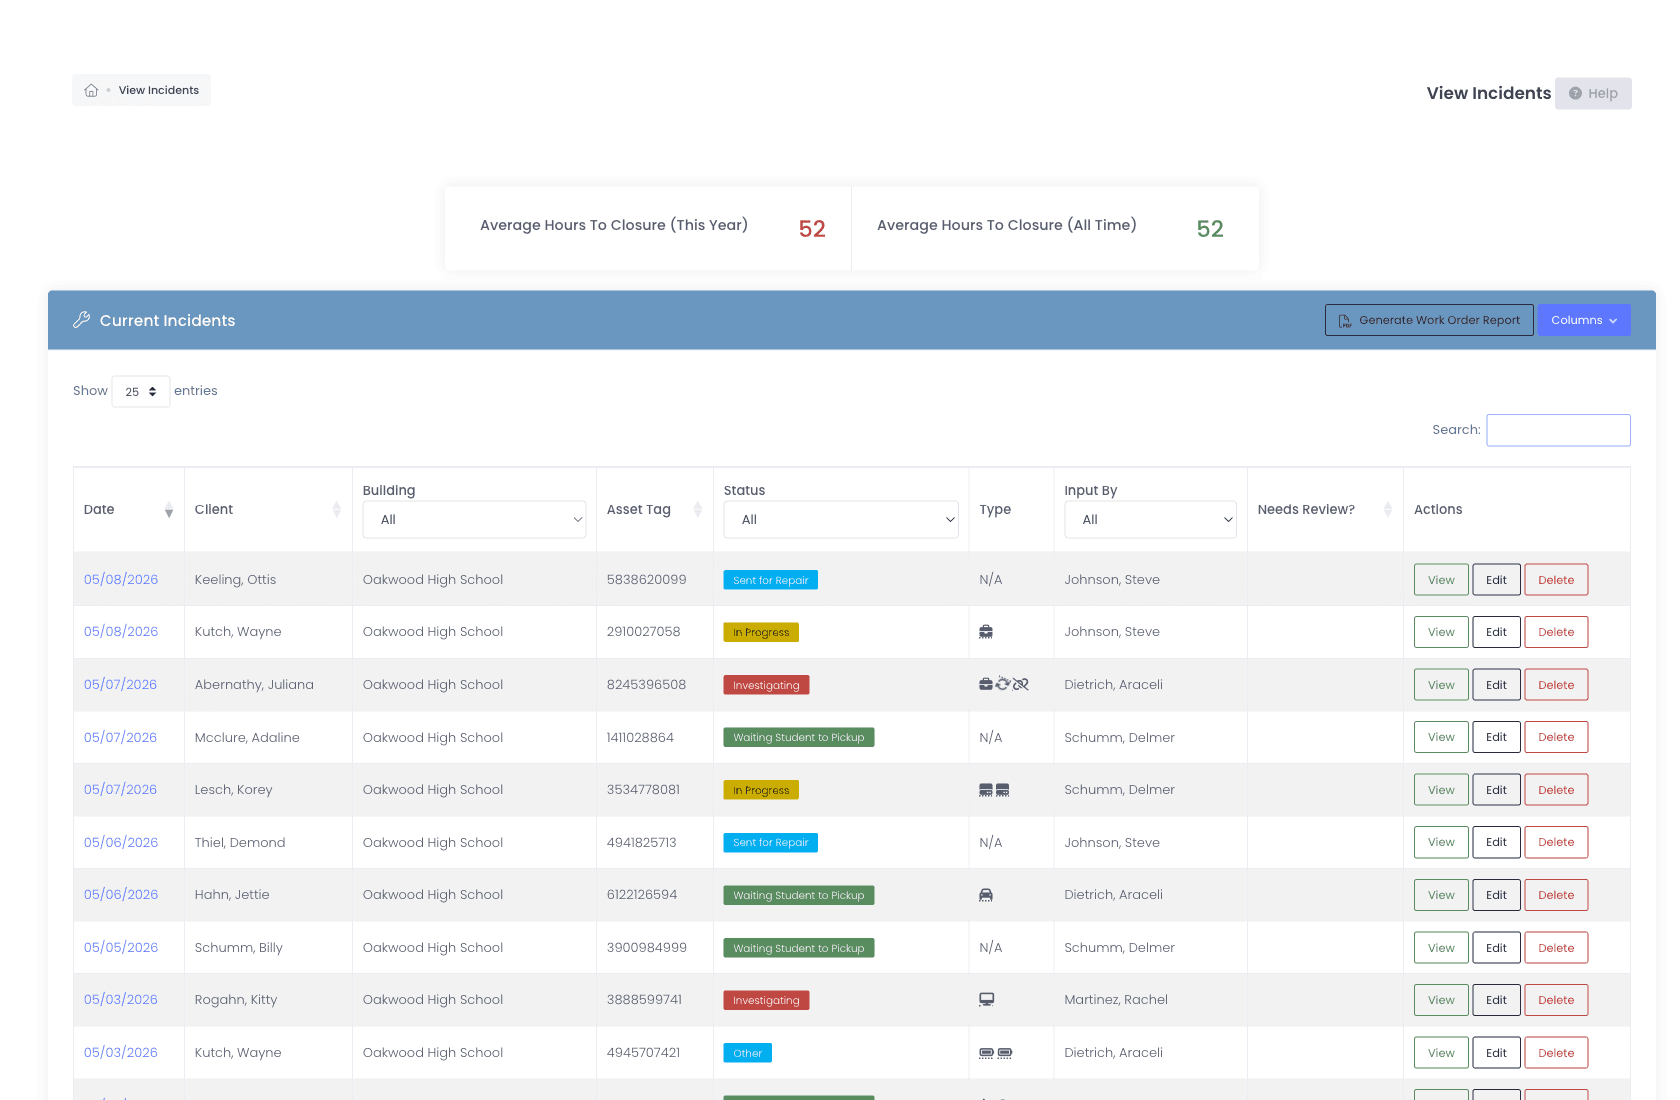
Average hours to closure, across every incident.
View Incidents pairs the year-over-year average-hours-to-closure KPI with the live incident queue underneath. Color-coded status pills (Sent for Repair, In Progress, Investigating, Waiting Student to Pickup) make queue health legible at a glance, sort by date, building, or assignee.
- Average Hours to Closure, this year vs all time
- Current Incidents queue with color-coded status pills
- Filter by building, status, asset tag, type, or assignee
- Generate Work Order Report straight from the queue
CSV everywhere
Every report. Exportable. Auditable.
Board meetings, grant reports, state audits, they all want CSVs. Every report and every list view in our platform ships with CSV, Excel, and Copy exports. Filters carry over. Custom fields included.
- Every report has CSV + Excel + Copy export, no exceptions
- Filtered views export exactly what you see
- Custom fields included in exports
- CSV import for bulk updates back into the system
- Pull the same data via the Manage1to1 API for any external BI tool
Why schools choose Manage1to1
Built for K-12. Not retrofitted from enterprise IT.
Numbers a Tech Director can defend
Real metrics, built from the actual ticket + device + incident data, no separate analytics tool to sync, no Tableau license to buy.
Built for board meetings
CSV export everywhere. Per-role dashboards. The data is ready for the agenda packet, not stuck behind a query builder.
Live, not nightly
Dashboards reflect the current database. When you ask "how many tickets are open right now?" the answer matches what the technician sees.
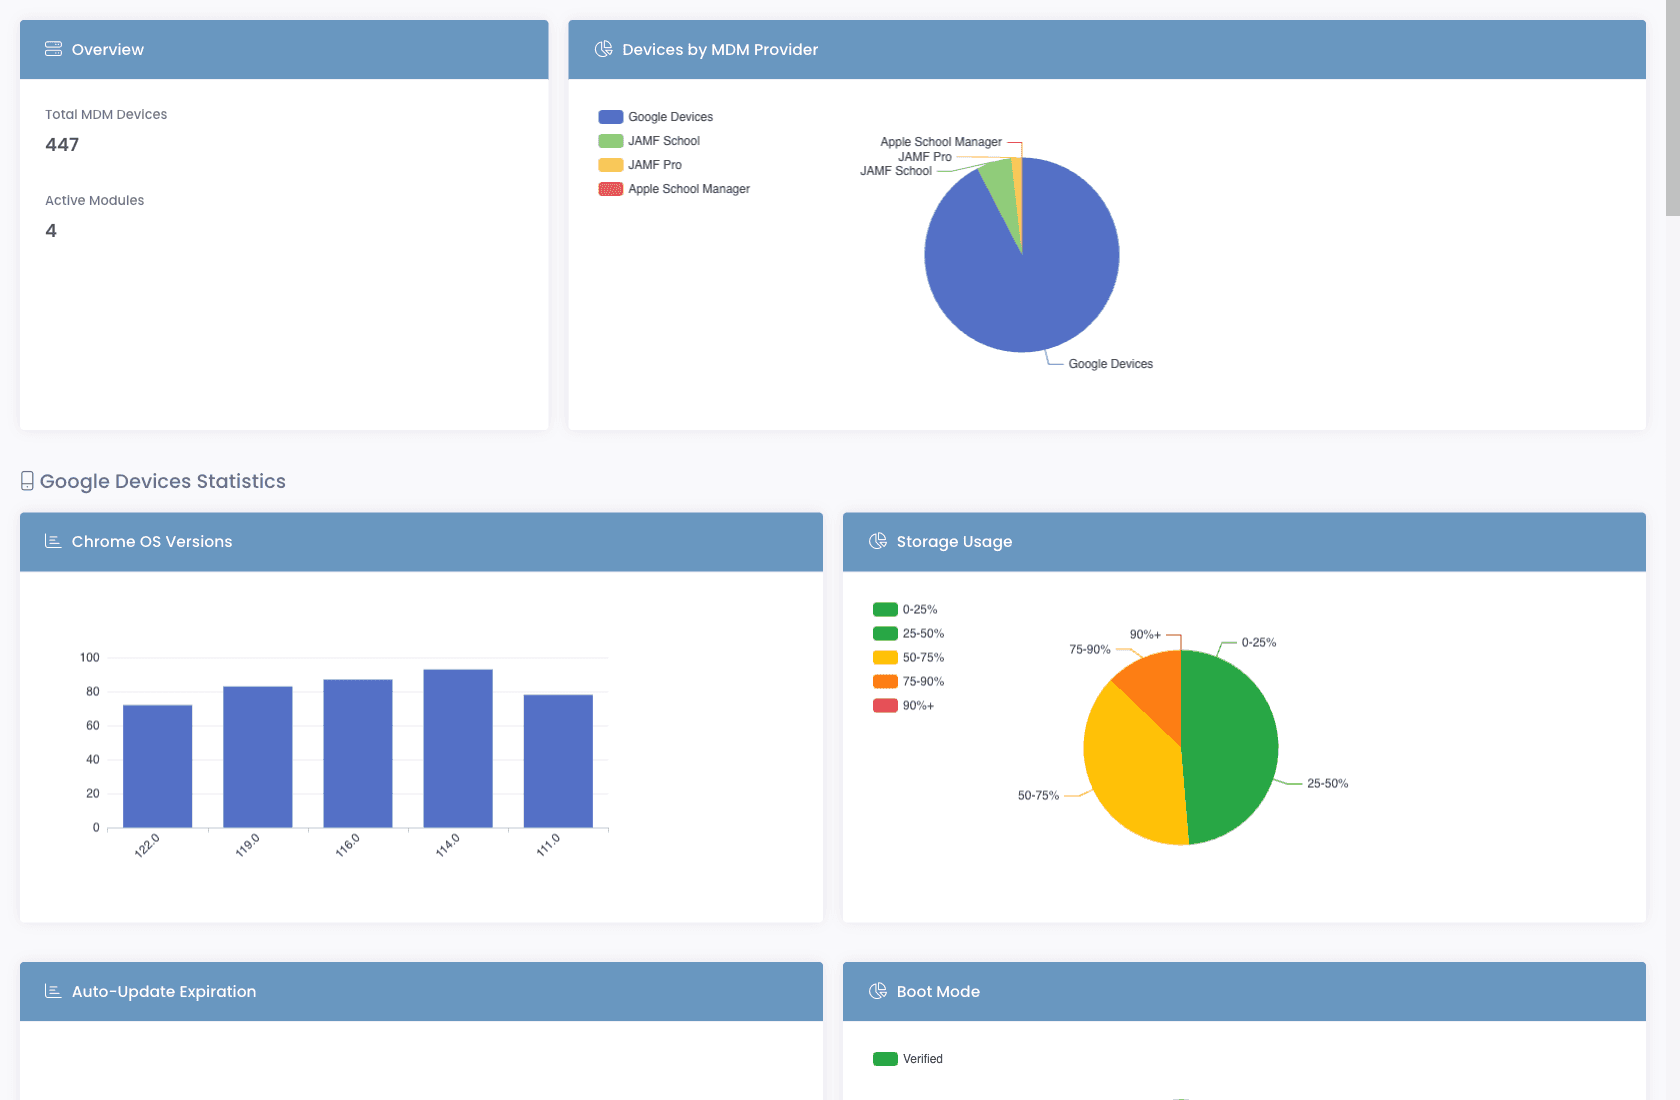
Cross-MDM in one place
JAMF, Google, Apple School Manager, fleet stats rolled up across every MDM you run. Stop tab-hopping between vendor consoles for the same number.
FAQ
Common questions.
- Live. Ticket, incident, loaner, and invoice counters reflect the current state of the database. MDM-sourced fleet data syncs continuously from JAMF, Google, and Apple School Manager, usually within minutes of a change in the vendor console.
- Yes. The Customize button on the dashboard lets you show, hide, and reorder cards. Different roles can save their own dashboard layout, a technician's view is different from a tech director's.
- Every report and every list view has CSV, Excel, and Copy export buttons. Filters carry over. Custom fields included. Pull the file the morning of the meeting and drop it into your packet.
- Yes. The Support Dashboard trends ticket volume, resolution time, and tech-vs-user replies over time. Filter by department, building, technician, or ticket type, the comparison cuts both vertically (this month vs last) and horizontally (this team vs another).
- You can pull CSV exports into any BI tool, or wire one up to the Manage1to1 API for live data. Most districts find the built-in dashboards already answer what the board and superintendent are asking, but if you need to feed an enterprise data warehouse, the API is there.
See it in action
Walk into the board meeting prepared.
Request a demo and explore the reporting dashboards with sample district data. Every number that matters for K-12 IT, already on the page.
- Quote tailored to your enrollment + SLA tier
- Migration plan from your current help-desk / asset tool
- Integration map for your MDM, SIS, and payment processor
- Honest answers — our team is all former K-12, we know what the product does and doesn’t do
Prefer the shared demo first? Try it at manage1to1.com/demo.